# Working with a laser rangefinder
## Rangefinder VL53L1X
The rangefinder model recommended for Clever is STM VL53L1X. This rangefinder can measure distances from 0 to 4 m while ensuring high measurement accuracy.
The [image for Raspberry Pi](microsd_images.md) contains pre-installed corresponding ROS driver.
### Connecting to Raspberry Pi
> **Note** For correct operation of a laser rangefinder with a flight countroller custom PX4 firmware is needed. See more about firmware in [corresponding article](firmware.md).
Connect the rangefinder to pins 3V, GND, SCL and SDA via the I²C interface:
 If the pin marked GND is occupied, you can use another free one using the [pinout](https://pinout.xyz).
> **Hint** Via the I²C interface, you can connect several peripheral devices simultaneously. For this purpose, use a parallel connection.
### Enabling
[Connect via SSH](ssh.md) and edit file `~/catkin_ws/src/clever/clever/launch/clever.launch` so that driver VL53L1X is enabled:
```xml
```
By default, the rangefinder driver sends the data to Pixhawk (via topic `/mavros/distance_sensor/rangefinder_sub`). To view data from the topic, use command:
```(bash)
rostopic echo mavros/distance_sensor/rangefinder_sub
```
### PX4 settings
To use the rangefinder data in [PX4 must be configured](px4_parameters.md).
When using EKF2 (`SYS_MC_EST_GROUP` = `ekf2`):
* `EKF2_HGT_MODE` = `2` (Range sensor) – when flying over horizontal floor;
* `EKF2_RNG_AID` = `1` (Range aid enabled) – in other cases.
When using LPE (`SYS_MC_EST_GROUP` = `local_position_estimator, attitude_estimator_q`):
* The "pub agl as lpos down" flag is ticked in the `LPE_FUSION` parameter – when flying over horizontal floor.
### Obtaining data from Python
To obtain data from the topic, create a subscriber:
```python
from sensor_msgs.msg import Range
# ...
def range_callback(msg):
# Processing new data from the rangefinder
print 'Rangefinder distance:', msg.range
rospy.Subscriber('mavros/distance_sensor/rangefinder_sub', Range, range_callback)
```
### Data visualization
To build a chart using the data from the rangefinder, one can use rqt_multiplot.
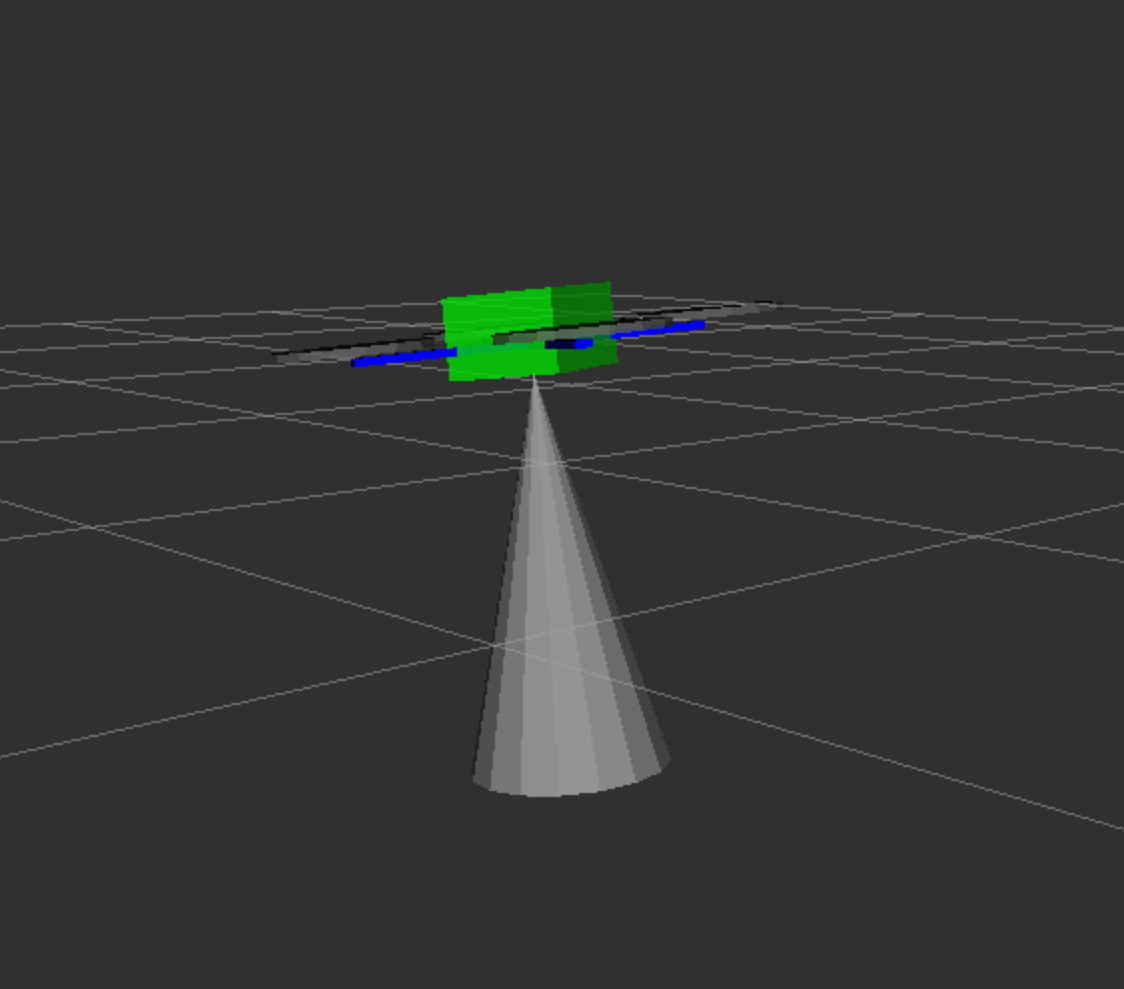
rviz may be used for data visualization. To do this, add a topic of the `sensor_msgs/Range` type to visualization:
If the pin marked GND is occupied, you can use another free one using the [pinout](https://pinout.xyz).
> **Hint** Via the I²C interface, you can connect several peripheral devices simultaneously. For this purpose, use a parallel connection.
### Enabling
[Connect via SSH](ssh.md) and edit file `~/catkin_ws/src/clever/clever/launch/clever.launch` so that driver VL53L1X is enabled:
```xml
```
By default, the rangefinder driver sends the data to Pixhawk (via topic `/mavros/distance_sensor/rangefinder_sub`). To view data from the topic, use command:
```(bash)
rostopic echo mavros/distance_sensor/rangefinder_sub
```
### PX4 settings
To use the rangefinder data in [PX4 must be configured](px4_parameters.md).
When using EKF2 (`SYS_MC_EST_GROUP` = `ekf2`):
* `EKF2_HGT_MODE` = `2` (Range sensor) – when flying over horizontal floor;
* `EKF2_RNG_AID` = `1` (Range aid enabled) – in other cases.
When using LPE (`SYS_MC_EST_GROUP` = `local_position_estimator, attitude_estimator_q`):
* The "pub agl as lpos down" flag is ticked in the `LPE_FUSION` parameter – when flying over horizontal floor.
### Obtaining data from Python
To obtain data from the topic, create a subscriber:
```python
from sensor_msgs.msg import Range
# ...
def range_callback(msg):
# Processing new data from the rangefinder
print 'Rangefinder distance:', msg.range
rospy.Subscriber('mavros/distance_sensor/rangefinder_sub', Range, range_callback)
```
### Data visualization
To build a chart using the data from the rangefinder, one can use rqt_multiplot.
rviz may be used for data visualization. To do this, add a topic of the `sensor_msgs/Range` type to visualization:
 See [read more about rviz and rqt](rviz.md).